The Nasal Lab Research preview

A breath is more
than an open space.

Explore how air moves through your own nasal anatomy. See the flow. Follow the heat. Ask better questions about what you feel.

Inside the lab
Built from an existing CTSimulated on your Mac
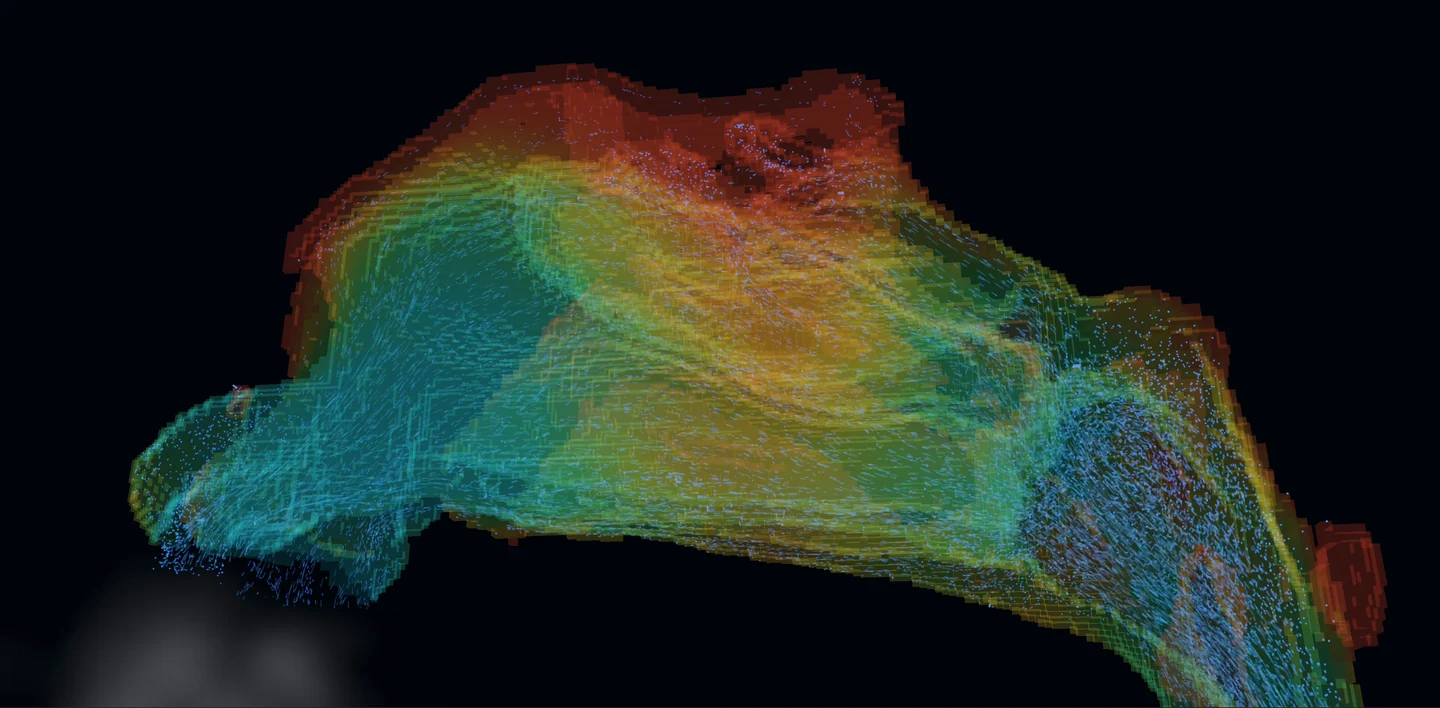
Actual Body4D airflow simulation

Start with a scan you already have. Only use CT scans taken for proper medical reasons. Never get a CT scan just to use Body4D. CT uses ionizing radiation, which can increase cancer risk. Body4D is for exploration and understanding, not diagnosis or treatment decisions. About CT safety

A small space. A profound impact.

What you feel
deserves to be
understood.

Nasal obstruction can be hard to explain. The experience may change with posture or over time, while a scan captures one moment. Body4D explores how a more dynamic view could help people communicate that experience.

Empty nose syndrome is a recognized condition in which an airway can appear open while breathing feels obstructed. Its mechanisms remain incompletely understood. Patients’ experiences deserve careful attention.

Read the AAO-HNS position statement on ENS

The ambition is simple: make the invisible easier to discuss, so patients and researchers can ask more precise questions together.

Inside the research prototype

See the airway.
Explore the physics.

More than a reconstruction: a place to investigate airflow and heat transfer within the geometry of an existing scan.

Breathing simulation
  • Follow a breath

    Visualize transient airflow and streamlines through a reconstructed nasal airway using GPU fluid simulation.

  • Look beyond the flow

    Explore sensible heat transfer, wall temperature and wall heat flux alongside the airway’s area–distance profile.

  • Compare virtual changes

    Investigate how a geometric change may alter simulated flow. Virtual turbinate reduction is an experimental model, not a prediction of a surgical outcome.

  • A foundation for a changing nose

    Exploratory swelling controls are a starting point. The horizon is a tissue-response model matched to how your own nose changes with body position over minutes. Explore the idea below.

The lab is a research prototype. Specialized nasal segmentation is under evaluation; the current workflow supports existing nasal studies. Results depend on model assumptions and are not validated for clinical decisions.

On the horizon · Patient-calibrated tissue response

Your position changes.
Your nose responds.

What if a model could show how the soft lining inside your nose responds after you lie down, roll onto your side or sit up again?

The ambition is to model which tissue swells, by how much, and how quickly it settles—then see how that changing shape affects airflow and the feeling of blockage over time.

A conceptual view of tissue swelling after a change in positionTwo simplified nasal passages. The coloured lining changes gradually as the time slider moves. This is an explanatory schematic, not patient anatomy or a prediction.Left passageRight passageColoured edge: soft liningBlue: space for air

A response that unfolds over minutes.

In this left-side illustration, the lining on the left gradually takes up more space. The airway changes after the position changes; it does not jump instantly to a new shape.

Just changed5 min10 min15 min

Choose a position, then move the time slider. This schematic illustrates the idea only; its shapes and timing are not measured patient responses.

Body positionTissue response over timeAirway & airflowExperience of breathing

For patients: show the part a snapshot misses.

“It starts blocking a few minutes after I turn over” could become a pattern you and your doctor can explore together, including what happens when you sit up again.

For doctors: distinguish shape from response.

The future model would aim to separate fixed anatomy from tissue that changes with position, follow each region’s swelling and recovery, and account for the nose’s natural alternating congestion cycle.

Exploratory posture controls are a starting point. Matching tissue movement and its timing to an individual’s measurements—and predicting their symptoms or response to treatment—remains on the research horizon.

The potential, brought together

From “I can’t breathe”
to a clearer picture.

The proposed report connects where and when the nose blocks, how virtual treatments compare, and the reasoning behind a focused plan. Its full measures are shown below, with plain-language explanations alongside them.

Body4DNasal LabFuture report concept · All values synthetic

A fictional patient.
A very recognizable problem.

“I feel fine sitting here. But when I lie on my left side, my nose blocks up.”

This sample follows a 38-year-old with left-sided blockage that worsens in bed. It shows what a future report could help explain, using the illustrative case from the research proposal.

Sample case · PNC-0217 · male, 38

Left blockage, worse lying left and on the back; comfortable in the clinic chair.

NOSE: 70 · ENS6Q: 3
Menthol sensitivity: normal

NOSE and ENS6Q are symptom questionnaires. All case details are fictional.Fictional patient, simulated examples. These are proposed research outputs, not current clinical results or treatment recommendations.
1 / Where and when it blocks

Separate fixed anatomy, swelling and position.

A narrow passage can reflect fixed anatomy, a swollen lining, or an extra response to body position. The proposed report would help separate their contributions.

Structural · fixed anatomyErectile · reversible tissue swellingPositional · body-position response

Left-side resistance, Pa·s/cm³. A longer bar means air is harder to move through the passage. “After decongestion” illustrates the remaining resistance when swelling is reduced.

63%

of the modeled resistance in the worst position comes from the position-related component.

That changes the question.

Instead of asking only “What looks narrow on the scan?”, the report asks “What changes when this person actually struggles to breathe?”

Potential contribution: give a fluctuating symptom a visible explanation, and help the doctor distinguish a fixed obstruction from a dynamic tissue response.

Locate the tissue driving the change.

The proposal links the changing airway to specific regions. The inferior turbinate (IT) is the lower tissue-covered structure inside the nose; its head (front), body (middle) and tail (back) need not behave alike.

Share of the posture-related rise in the source illustration. Schematic, not to scale. The source labels total 97%; the remainder is not assigned.

Upright
MCA · narrowest opening: 0.48 cm²
1.9 cm from the nostril

Lying left
MCA · narrowest opening: 0.29 cm²
3.1 cm from the nostril

The bottleneck can move.

MCA means minimum cross-sectional area: the narrowest opening along the passage.

In this example, the front of the left lower turbinate becomes the main changing region. The model points toward its first 15 mm as a place to investigate.

A visible bony projection farther back—the septal spur—accounts for only 6% of resistance in the difficult position. Looking prominent does not automatically make it the main target.

Potential contribution: explain why a focused change might make sense, why an obvious scan finding might be left alone, and why the other side may not need treatment.

2 / Virtual surgery in the difficult position

Compare the complete picture.

All key measures, side by side. Surgical options are modeled after 15 minutes lying left—the fictional patient’s worst position. Every number is synthetic.

Select an option name for its explanation. On a small screen, scroll the table sideways to see every measure.

Illustrative comparison · VAS, resistance, cooling, airflow, WSS, tissue and research flag
OptionVAS0–10RPa·s/cm³Cooled areacm²IM flow%IM WSSPa · peakTissuecm³ENS-risk check*Research only
7.80.92833%1.0——
2.10.222722%0.63.1Flagged*
2.90.411941%1.20.3Within example bounds*
2.70.382040%1.20.3 + septumWithin example bounds*
6.60.801034%1.00.0Not applicable

*The proposed check flags IM flow <30% or IM WSS <0.8 Pa. These are provisional research assumptions, not validated ENS-risk thresholds. Being within the example’s bounds cannot establish safety or rule out ENS.

B · Focus on the part that swells

Treat only the front 15 mm of the left lower turbinate, using a hypothetical radiofrequency treatment beneath the lining.

The idea is to limit how much this tissue swells. The example focuses on the tissue response, leaves the right side alone and avoids an additional septum operation.

Blockage score · VAS
2.9out of 10 · lower means less blockage
Tissue amount in the example
0.3cm³ · illustrative treatment extent
Inferior-meatus airflow · IM flow
41%flow share in this illustration
Airflow resistance · R
0.41Pa·s/cm³ · how hard air is to move
Peak wall shear stress · WSS
1.2Pa · airflow friction along the lower-passage lining
Cooled lining area
19cm² · where heat leaves the lining

Within the example’s airflow bounds. This is not proof of safety or an ENS risk prediction.

What each measure tells you

VAS · blockage score
A 0–10 rating of how blocked breathing feels. Lower means less blockage in this illustrative symptom model.
R · airflow resistance
How hard it is to move air through the passage. This describes the overall effort needed to move air.
Cooled area · heat transfer to the air
How much lining loses heat to airflow above the chosen threshold. Nasal cooling is one factor related to the sensation of airflow.
IM flow · inferior-meatus airflow
The airflow share travelling through the lower passage beside the inferior turbinate. It shows where air goes.
WSS · peak wall shear stress
The friction of moving air along the lining, here in the lower nasal passage. It adds a local view of how air interacts with tissue. Higher is not automatically better; WSS is not a direct measure of sensation.
Tissue · extent of the intervention
The tissue amount in the example. RF means radiofrequency treatment; septoplasty changes the dividing wall between the nasal passages.

Cooled area uses wall heat flux above 50 W/m². WSS and procedure-specific response are proposed research outputs. Option D is the original non-surgical bundle; its value does not separate medication from sleeping position or establish a same-posture treatment effect.

Dose–response: how little change could be enough?

The proposed “dose–response” view asks what happens as treatment becomes more extensive: does relief keep improving, and does air still reach the lining we want to preserve?

Two ways a tissue treatment could help. It could change how much space the tissue occupies, or reduce how strongly it swells after a change in position. The proposed model would study both: the smallest useful treatment may depend on the tissue’s response over time as well as its size on a scan.

Schematic research curve: targeted option B reaches a blockage score of 2.9 at 0.3 cubic centimetres, while broad option A reaches 2.1 at 3.1 cubic centimetres.Relief versus treatment extentExample goal: score ≤3B · 2.9A · 2.1Before · 7.810003.1Tissue amount in the example (cm³) Schematic research curve: lower-passage airflow is 41 percent for B and 22 percent for A. The example's 30 percent line is provisional, not a validated safety threshold.Air reaching the lower passage30% · provisional research lineB · 41%A · 22%50%10%03.1Tissue amount in the example (cm³)
Focused treatment at the frontBroader full-length treatment

Schematic curves adapted from the proposal, not fitted clinical data. Only the labeled option values are supplied synthetic results. Neither the symptom goal nor the airflow line is a validated clinical threshold.

The same conversation includes tissue preservation.

A · Broader
3.1 cm³
B · Focused
0.3 cm³

About 90% less tissue in the focused example, with a modeled score of 2.9 rather than 2.1. The proposed question is whether a smaller change could deliver enough benefit while preserving function.

Check airflow and wall shear stress (WSS).

In the example, peak WSS in the lower passage changes from 1.0 Pa before treatment to 0.6 Pa with A or 1.2 Pa with B. A gives lower resistance, but also a smaller share of air travelling through the lower passage and lower peak WSS there.

Considering WSS alongside cooling and airflow distribution could help a doctor compare relief with preservation of nasal function. WSS does not directly measure nerve function or how breathing feels.

The broader option triggers the sample’s research flag. The focused option does not—but that cannot establish safety, predict ENS or rule it out. Sensory function and other factors also matter.

The proposal’s IM flow <30% or IM WSS <0.8 Pa flags are provisional research assumptions, not validated ENS screening criteria.

3 / Proposed plan and counselling

Plan B in this fictional case—and why.

The proposal’s example brings the location, treatment extent, airflow checks and expected experience into one rationale that a patient and doctor could discuss.

Focus on the left turbinate head.

  • Anterior 15 mm, about 0.3 cm³: the proposed RF / coblation treatment beneath the lining aims to reduce swelling amplitude—how strongly the tissue can swell.
  • Leave the posterior spur: at 5.6 cm from the nostril, it accounts for 6% of worst-position resistance. Adding septoplasty changes the example’s VAS by only 0.2 points.
  • No operation on the right: its resistance stays between 0.27 and 0.45 Pa·s/cm³ across positions in the sample.

Explain the benefit and the uncertainty.

  • Worst-position VAS: 7.8 → 2.9. The synthetic 80% prediction interval is 1.7–4.1.
  • About 90% less tissue than A. IM flow is 41% and peak IM WSS is 1.2 Pa, within the example’s provisional bounds.
  • A research question to validate. The model would need to show that its predicted relief and tissue response match real measurements. Its airflow checks cannot rule out ENS.

Predicted feel, by posture and time.

A single improvement score cannot show every position or every moment. A future report would aim to make those differences visible, including the delay after turning over.

Synthetic left-side blockage score (VAS) · 0 = none, 10 = most severe

Less blockageMore blockage
7.8 / 10

The difficult position, after 15 minutes.

Lying left starts at 3.4 and rises to 7.8 in the example. Sitting upright stays near 3. A clinic snapshot would miss this contrast.

Show uncertainty too. For B, the proposal illustrates a score of 2.9 with an 80% prediction interval of 1.7–4.1. The range demonstrates how uncertainty could be communicated; its reliability has not been established.

Potential contribution: a shared picture of everyday breathing, so patients can explain what matters to them and doctors can discuss expected benefits, remaining symptoms and uncertainty.

For patients

  • Make position-dependent suffering easier to explain.
  • Understand why a particular region is being considered.
  • Compare the potential benefit and extent of different options.
  • See what the model knows—and what remains uncertain.

For doctors

  • Connect anatomy to a changing symptom pattern.
  • Investigate fixed versus reversible causes, region by region.
  • Compare interventions in the patient’s difficult positions.
  • Make tissue preservation and the reasoning behind a plan explicit.

Model confidence and limits

The aim is to anchor the changing model to the person’s own measurements, rather than assume everyone’s tissue responds in the same way.

Measure the response

Use sound-based measurements of airway size (acoustic rhinometry), pressure-and-flow tests (rhinomanometry), and side-specific symptom ratings in several positions over time.

Check the model

The sample lists AR fit RMSE 0.04 cm² (airway-area fit error), and CFD resistance within 9% of the measured value. AR means acoustic rhinometry; CFD means computational fluid dynamics, the simulated airflow. These illustrate checks to report; they are not achieved accuracy claims.

Expose the limits

The proposal uses MRI-informed assumptions beyond the front 6 cm, where sound-based measurements are less reliable, and accounts for the natural nasal cycle. Procedure response and symptom estimates need clinical validation.

Case context in the proposal: NOSE symptom questionnaire 70, ENS6Q questionnaire 3, menthol sensitivity described as normal. These fictional screening results do not validate the model. The hypothetical B aims to reduce swelling at the left turbinate’s front; it leaves the right side and the posterior spur untreated in this example.

Research ambition, clearly separated from current capability. All patient details and numbers here are synthetic. Patient-calibrated tissue response, symptom prediction, procedure-specific planning, wall shear stress and ENS-related checks remain research goals. This example cannot guide an individual treatment decision.
Source and scientific background

Reformatted from slide 17 of the PNC / Body4D proposal, with the tissue-response concept from slides 12–16. The proposed contribution is the connection between changing tissue, airflow, intervention extent and lived symptoms in one personal model. It is an ambition to test, not a claim of proven clinical superiority.

The work ahead

Better models.
More careful answers.

The research ambition goes beyond a compelling visualization. These capabilities still need development, calibration and validation.

  • Connect models to measured experience

    Calibrate posture and swelling against acoustic rhinometry, rhinomanometry and symptom measurements.

    In development
  • A fuller picture of sensation

    Investigate wall shear stress and evaporative cooling, alongside the existing sensible-heat simulation.

    Planned research
  • Compare changes with more care

    Study targeted intervention models and ENS-risk assessment. No model can currently rule out ENS or promise prevention.

    Planned research
Made personal. Kept private.

A closer look.
Entirely yours.

Your existing scan. Your own anatomy. A new way to understand the body you live in, with processing that stays on your Mac.

Body4D is an exploration tool, not a medical device for diagnosis or treatment. Scan coverage and quality affect what you can see. Use only medically indicated, existing scans.

Body4D for Mac

Free for everyone. The first public release is on its way.

Apple silicon · macOS 14+No subscription

The installer will be available here at launch.

Start with your existing CT’s DICOM files: one supported axial series. Optional organ-recognition models install once, then process locally. Includes 10 interface languages.

Help shape the research

Better questions
are a good beginning.

If you’re a patient, clinician or researcher with a perspective to share, I’d like to hear from you.

Start a conversation